Dashboard: from data to decisions
We transform industrial flows into visual insights, KPIs and trends that drive operations, quality and performance.
Build Custom Dashboards
View statistics and insights from your data with Muvia's powerful editor. Intuitive interface, advanced controls and complete customization.
Editor Dashboard
View statistics and insights from your data with Muvia's powerful editor. Intuitive interface, advanced controls and complete customization.
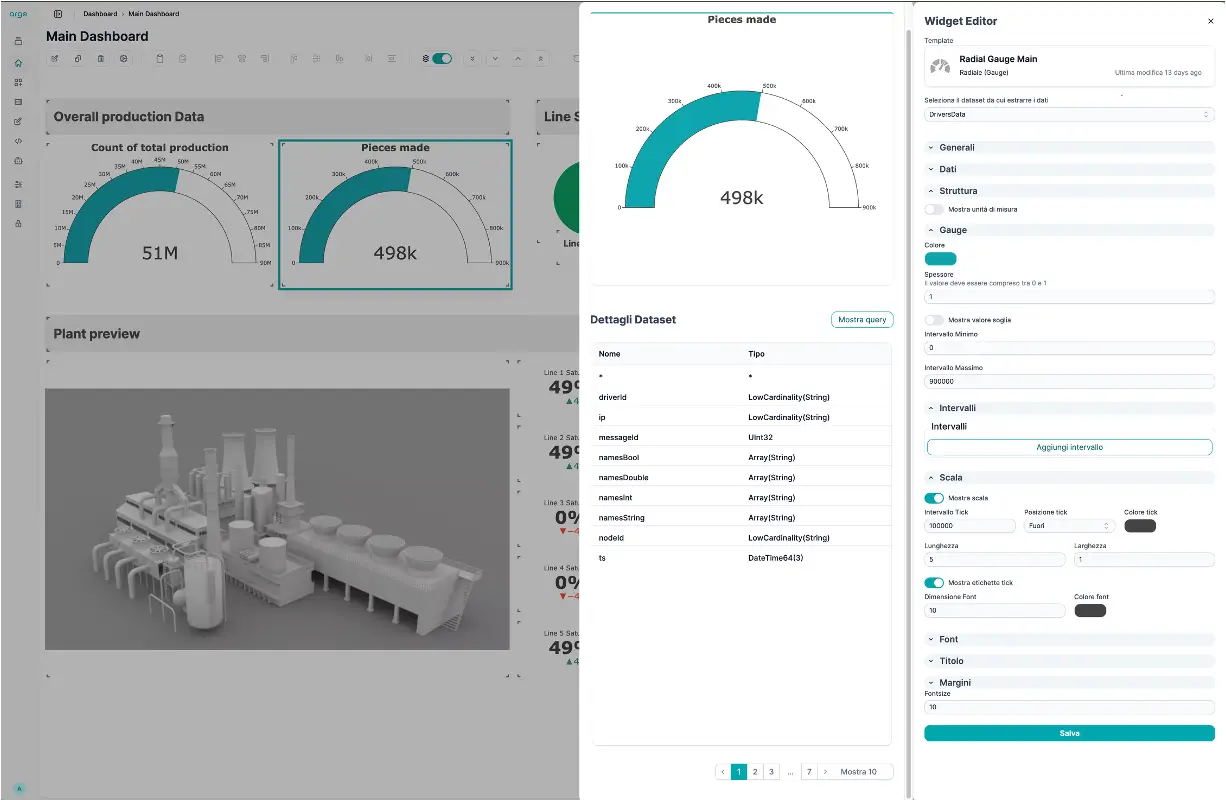
Editor features
Drag & Drop
Compose dashboards without writing code
Graphic Controls
Ready-to-use widgets for every need
Widget Management
Align, copy, paste, delete widgets
Replicable Templates
Create reusable templates
Duplicate
Duplicate, export and import dashboards
Custom Widgets
Development of custom widgets on request
Custom Widgets
With our support we can develop any customized widget not already present in the library, perfectly integrated with your workflow.
Adopt your own visualization technologies
In addition to its own Dashboard management engine, Muvia also allows you to use the most well-known visualization platforms on the market to guarantee maximum operational flexibility and reuse of company skills.
Performance of our Dashboards
Ultra-low latency data extraction
Dashboard smart and scalable
Filter and aggregate data in visualization, reducing processing and latency.
Ultra-Low Latency
Real-time processing with latencies less than 10ms
Processing and Bandwidth Reduction
Filter and aggregate in visualization, reduce processing and bandwidth costs by 35%
Start Today.
Free 14 day demo | No payment required
Free workshop with our consultants who will advise you on how to quickly integrate Muvia
Contact us
A quote, a particular request, or simply a coffee to meet us? Write to us and we will reply to a "nano-second".